Local Weather
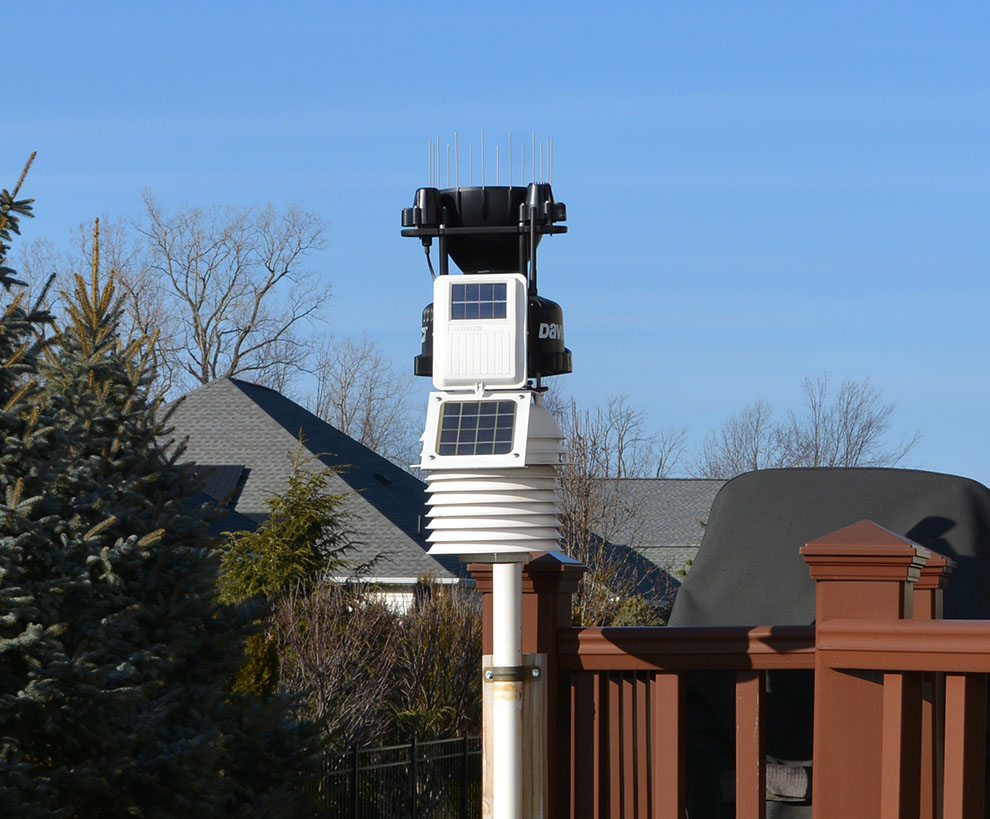
The weather data reported here is collected by a Davis Vantage Pro 2+ weather station belonging to and maintained by the webmaster. The Integrated Sensor Suite (ISS), which contains the sensors for all the data reported here except wind speed and direction and barometric pressure (as well as for some that aren’t!), is mounted off his back deck. The rain collector is not heated, so reported precipitation measurements are unreliable when the temperature is at or below freezing, and/or during a ‘thaw’ after snow has fallen. Wind speed and direction are recorded by an anemometer mounted above the webmaster’s roof peak, and barometric pressure is measured by a sensor in the weather station’s console, inside the house. The occasional problems which we encountered both last winter and the winter before, with the wind direction sensor intermittently giving a spurious North indication, seem again to have gone away. All the data from the outside sensors are transmitted wirelessly to the console and recorded and charted by software (weewx) running on a Raspberry Pi single-board computer. The timestamps below each chart show when that chart was generated. Charts that display longer-term data are updated less frequently, but even the charts that show a year’s data are updated at least daily.
Most of the data displayed here should be self-explanatory. Non-weather-geeks may not be very familiar with dew point estimates. The dew point is the temperature at which the amount of water vapor currently present in the air would start to condense. Unlike relative humidity, it gives a value for how ‘wet’ the air is that is independent of its current temperature. The ‘wetter’ the air is, the higher the dew point. If the air is saturated with water vapor, the dew point should be equal to the current temperature.
Weather station purists will note that the ISS location is not ideal. In particular, its radiation sensors are shaded from any sun by the adjacent house for part of every morning, particularly in the winter, and its rain collector would also be expected to experience some rain shadowing, though the magnitude of this effect seems to be small. The only consistent significant error in the data reported here will be missing sunshine time (which is calculated from solar radiation measurements) in the early morning, and a consequent reduction in the total sunshine hours reported for days when it was, in fact, sunny in the morning.

Current Conditions
Today's Weather


Last Week's Weather


Weather History
Last Month's Weather


Last Year's Weather


